Beta disclaimer: At this time, Advanced Insights is available for Lightspeed Restaurant customers in North America and is currently in public beta for customers in Australia and New Zealand. If you're located in this region and want to help test this feature, contact your Sales Account Manager or Lightspeed Support.
This report displays sales averages for each day of the week so that you can identify your busiest days and schedule staff or offer promotions accordingly.
Accessing the Day of week report
Advanced Insights organizes your sales data in a graph. To get started, choose a location and time frame.
- Sign in to your Advanced Insights dashboard.
- In the main navigation menu, click Sales. On the Sales page, select the Day of week tab.
- At the top of the navigation menu, click the Location drop-down and select whether to run the report for a particular location or All locations.
- By default, the report displays data for the last 28 days. To choose a different time frame, click the calendar drop-down in the upper right corner. Optionally, click Custom to specify the time period using a calendar, but you cannot select a date range longer than three months.
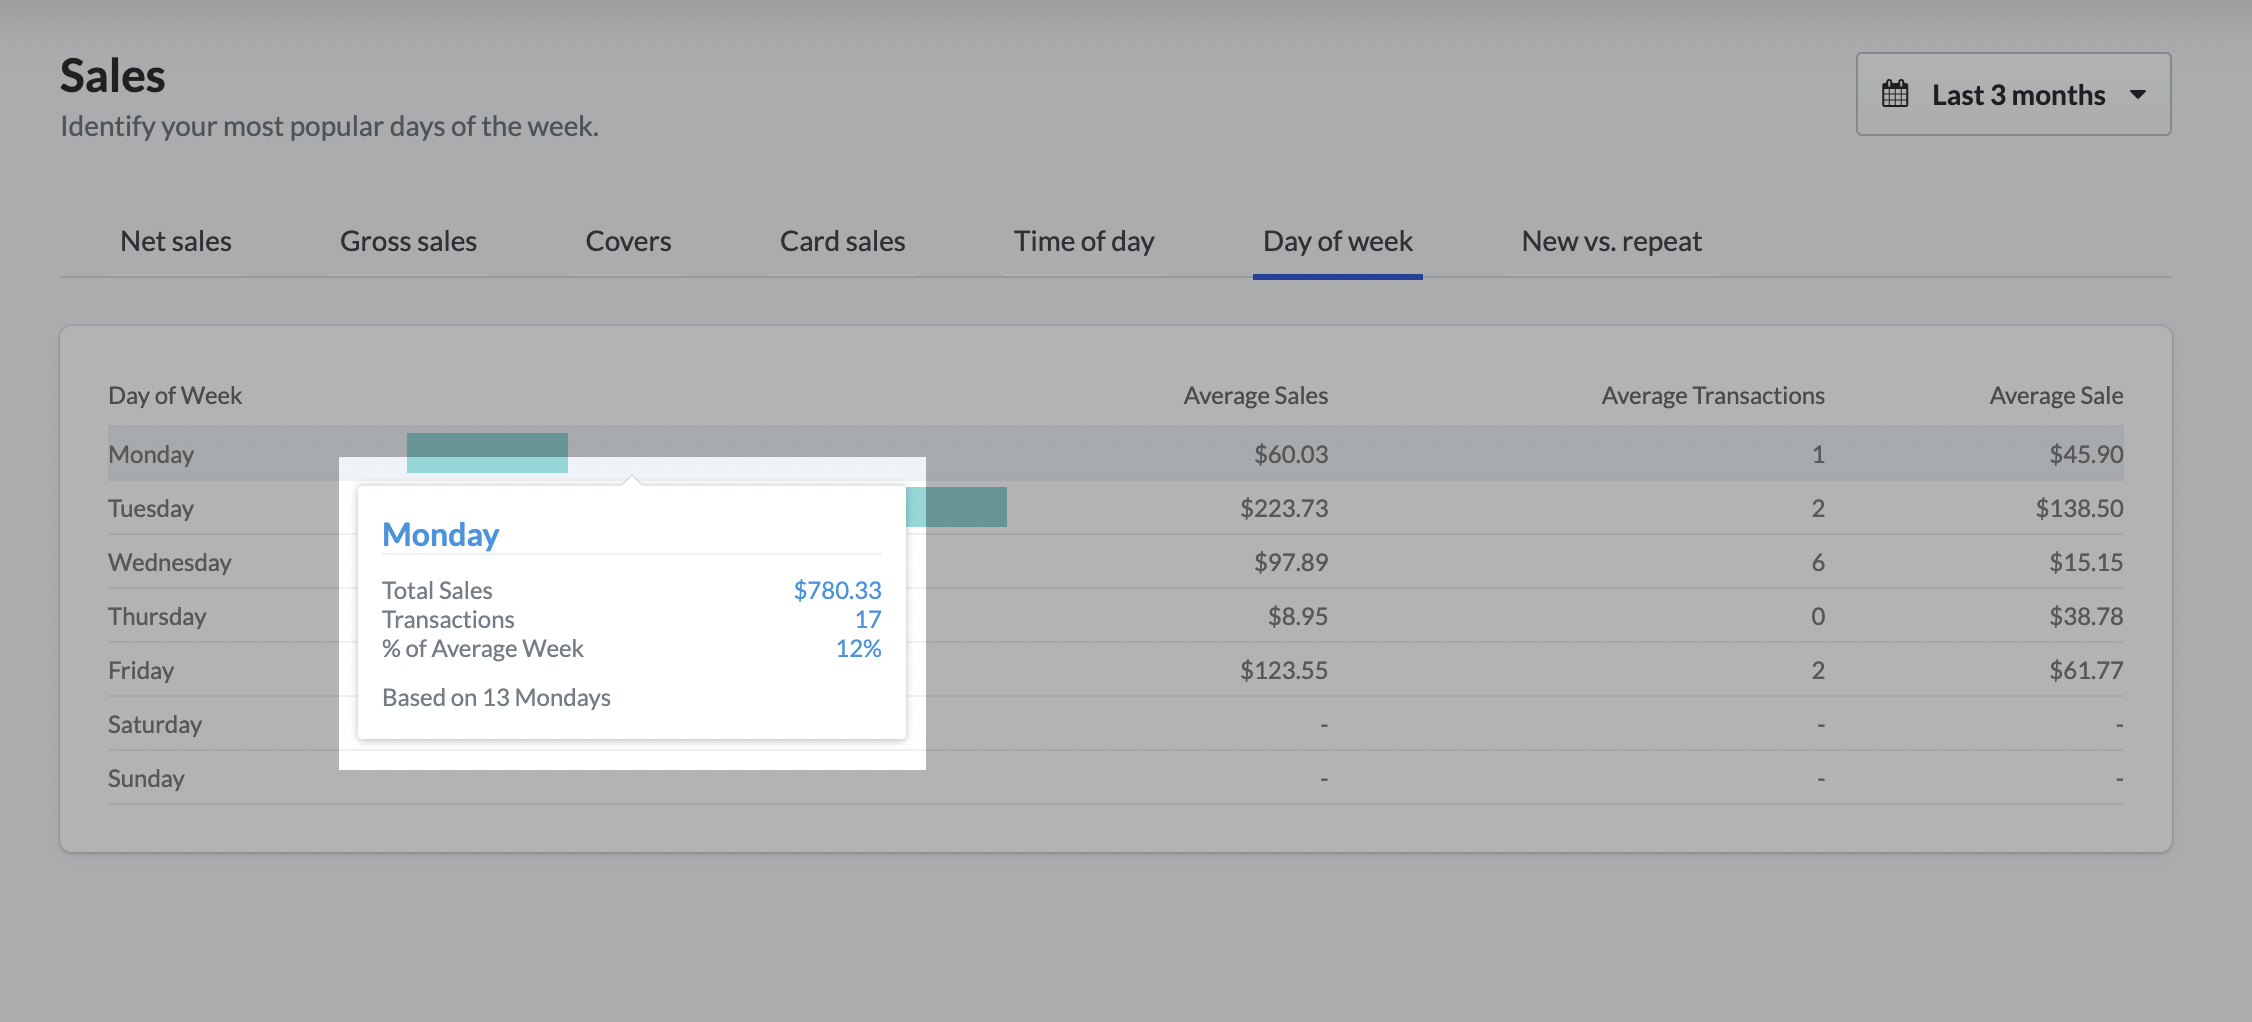
Understanding the Day of week bar chart
The Day of week bar chart is a visual representation of your sales data organized by days of the week. Hover over a bar to view the breakdown of Total Sales, Transactions, and % of Average Week for a given day. For a description of each metric, see the table below.
The breakdown also displays the total count of a day of the week during the specified time period (for example, filtering by the Last 3 months and hovering over Tuesday shows that your averages were calculated based on a total of 13 Tuesdays).
Day of week metrics
| Metrics | Description |
| Total sales | The total sales for a day of the week during the specified time period. |
| Transactions | The total number of transactions for a day of the week during a specified time period. |
| % of Average week |
A day’s sales as a percentage of the average weekly sale amount for the specified time period. For example, Tuesday’s sales make up 44% of the average weekly sales over the last 3 months |