Beta disclaimer: At this time, Advanced Insights is available for Lightspeed Restaurant customers in North America and is currently in public beta for customers in Australia and New Zealand. If you're located in this region and want to help test this feature, contact your Sales Account Manager or Lightspeed Support.
You can view a server's scorecard to discover their strengths and opportunities for improvement. Analyze their sales, discounts, and turn time over the past month compared to other servers on the same shift. Admins and Managers can also add and edit a server's contact information.
Accessing a server scorecard
To access a server's scorecard:
- Sign in to your Advanced Insights dashboard.
- At the top of the navigation menu, click the Locations drop-down and select a location.
- In the main navigation menu, click Servers. Scorecards can be accessed from any tab on the Servers page: Checks, Covers, Turn time, and Discounts.
- Click the server's name to view their server scorecard.
By default, Servers reports show the data for the last 28 days and only display servers who worked during that time frame. If a server hasn't worked in the last 28 days, change the reporting period using the Calendar drop-down to view their scorecard.
Understanding the server scorecard
Use the server scorecard to view a server's Employee profile, Strengths & opportunities, Average sale per cover, Turn time, Discounts, and Voids. For a description of each metric, view the table below.
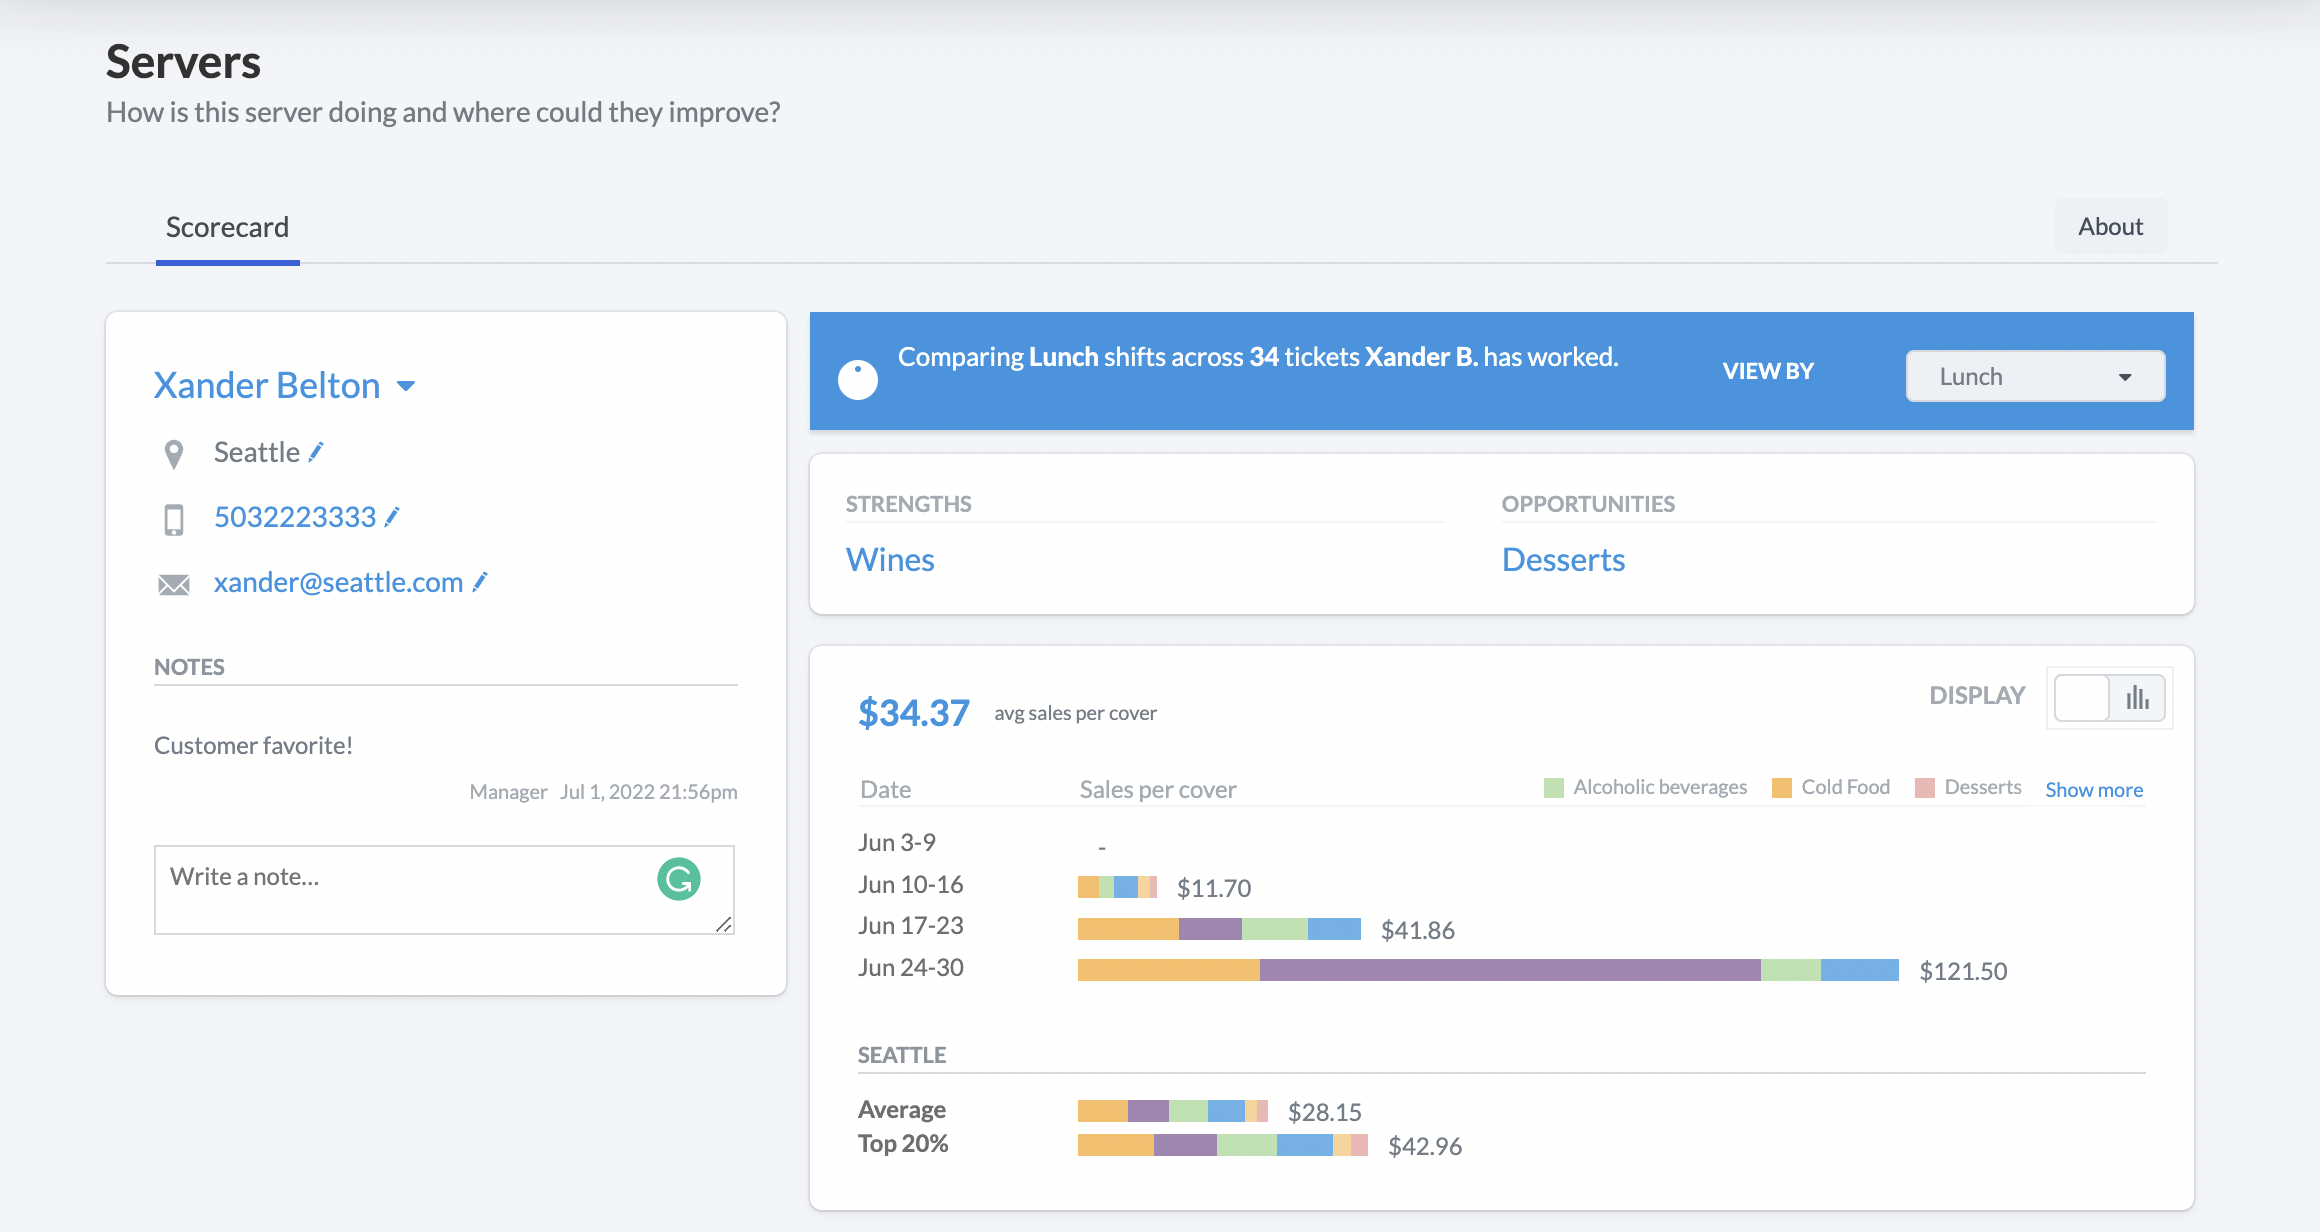
Scorecard metrics
| Metric | Description |
| Employee profile | Add a location, phone, and email address for the employee. You can also add notes. |
| Strengths & opportunities | The employee's best performing (strengths) and worst performing (opportunities) categories based on sales data. If a server is within the top 20th percentile for a category, the category is classified as a strength. If a server's performance falls below the average of a category, the scorecard identifies it as an opportunity for improvement. |
| Average sale per cover | The average sale amount per cover (or per person). |
| Turn time | The average time it takes a server to process an order. This is calculated from when the server sends the ticket to the kitchen to when they take payment for the bill. The graph shows the change in turn time over the month. The scorecard also compares this to the typical turn time range. |
| Discounts | The dollar amount of discounts applied by the employee for the specified time period. |
| Voids | The total number of voids (items removed from the bill) applied by the server for the specified time period. |